

What's Next in Measuring Dev Productivity? 📈
The four big shifts in measuring and using engineering metrics.


Last week I had a long chat with Abi Noda.
Abi is the CEO of DX, an engineering intelligence product designed by leading researchers. He also writes a fantastic newsletter, which you should check out if you are interested in developer experience and productivity.
The idea behind the chat was to learn more about DX Core 4 — their new framework for measuring developer productivity, which has already received high praise from some of my favorite authors, like Will and Lenny.
But we got side-tracked! I love this topic, so we ended up talking big picture and discussing all the progress that has happened over the last few years, and how the goal post is constantly moving as we learn new things.
The first time I wrote anything about engineering metrics was (checks notes) in September 2020, in the third article ever on Refactoring. I did so to cover a big win for my team at that time: improving our code review process. In just a few months we had been able to decrease the % of PRs approved without review from 20% to almost zero, and increase the % of those reviewed within 24 hours from ~50% to 96%.

We had done so with the help of a couple of tools, including Pull Panda, a handy app that collected analytics about your PRs and which, at the time, had just been acquired by Github.
The founder of Pull Panda was… Abi.
Fast forward a couple of years, Abi founded DX and I went full time on Refactoring.
So, this chat is not only delightfully fitting our respective journeys — it also comes at the right time, as I believe we are going through four major shifts in this space, which are worth exploring:
So here is the agenda for today:
📖 What is DX Core 4 — and how it builds on top of a decade of research.
📊 From telemetry to holistic metrics — adding qualitative data to the mix.
↩️ From lagging to leading indicators — focusing on actionable data.
🤏 From surveys to experience sampling — improving accuracy and granularity.
🔧 From “what to measure” to “how to use it” — focusing on operationalization.
Let’s dive in!
Disclaimer: I am a fan of what Abi and DX are building, and they graciously partnered on this piece. However, you will only get my unbiased opinion about all the practices and tools mentioned here, DX included.
You can learn more about DX below 👇
📖 What is DX Core 4
The two most popular engineering metrics frameworks out there are DORA and SPACE, which have shaped how we think about developer productivity over the last decade.
However, they both face recurring criticism:
🎯 DORA is precise but narrow — it gives you exact metrics to track, but only covers a small slice of what makes engineering teams effective. I.e. your delivery.
🌊 SPACE is comprehensive but vague — it gives you a complete picture of what matters, but teams often don't know what to do with it. What should you measure exactly? How do you implement it in practice?
DX Core 4—which comes from some of the same authors of DORA and SPACE—tries to hit a sweet spot by being, at once, 1) more comprehensive than DORA, and 2) more prescriptive than SPACE.
It breaks down developer productivity into four dimensions, and for each of them it recommends 1) a key metric you should track, and 2) a few secondary ones to really deep dive into.
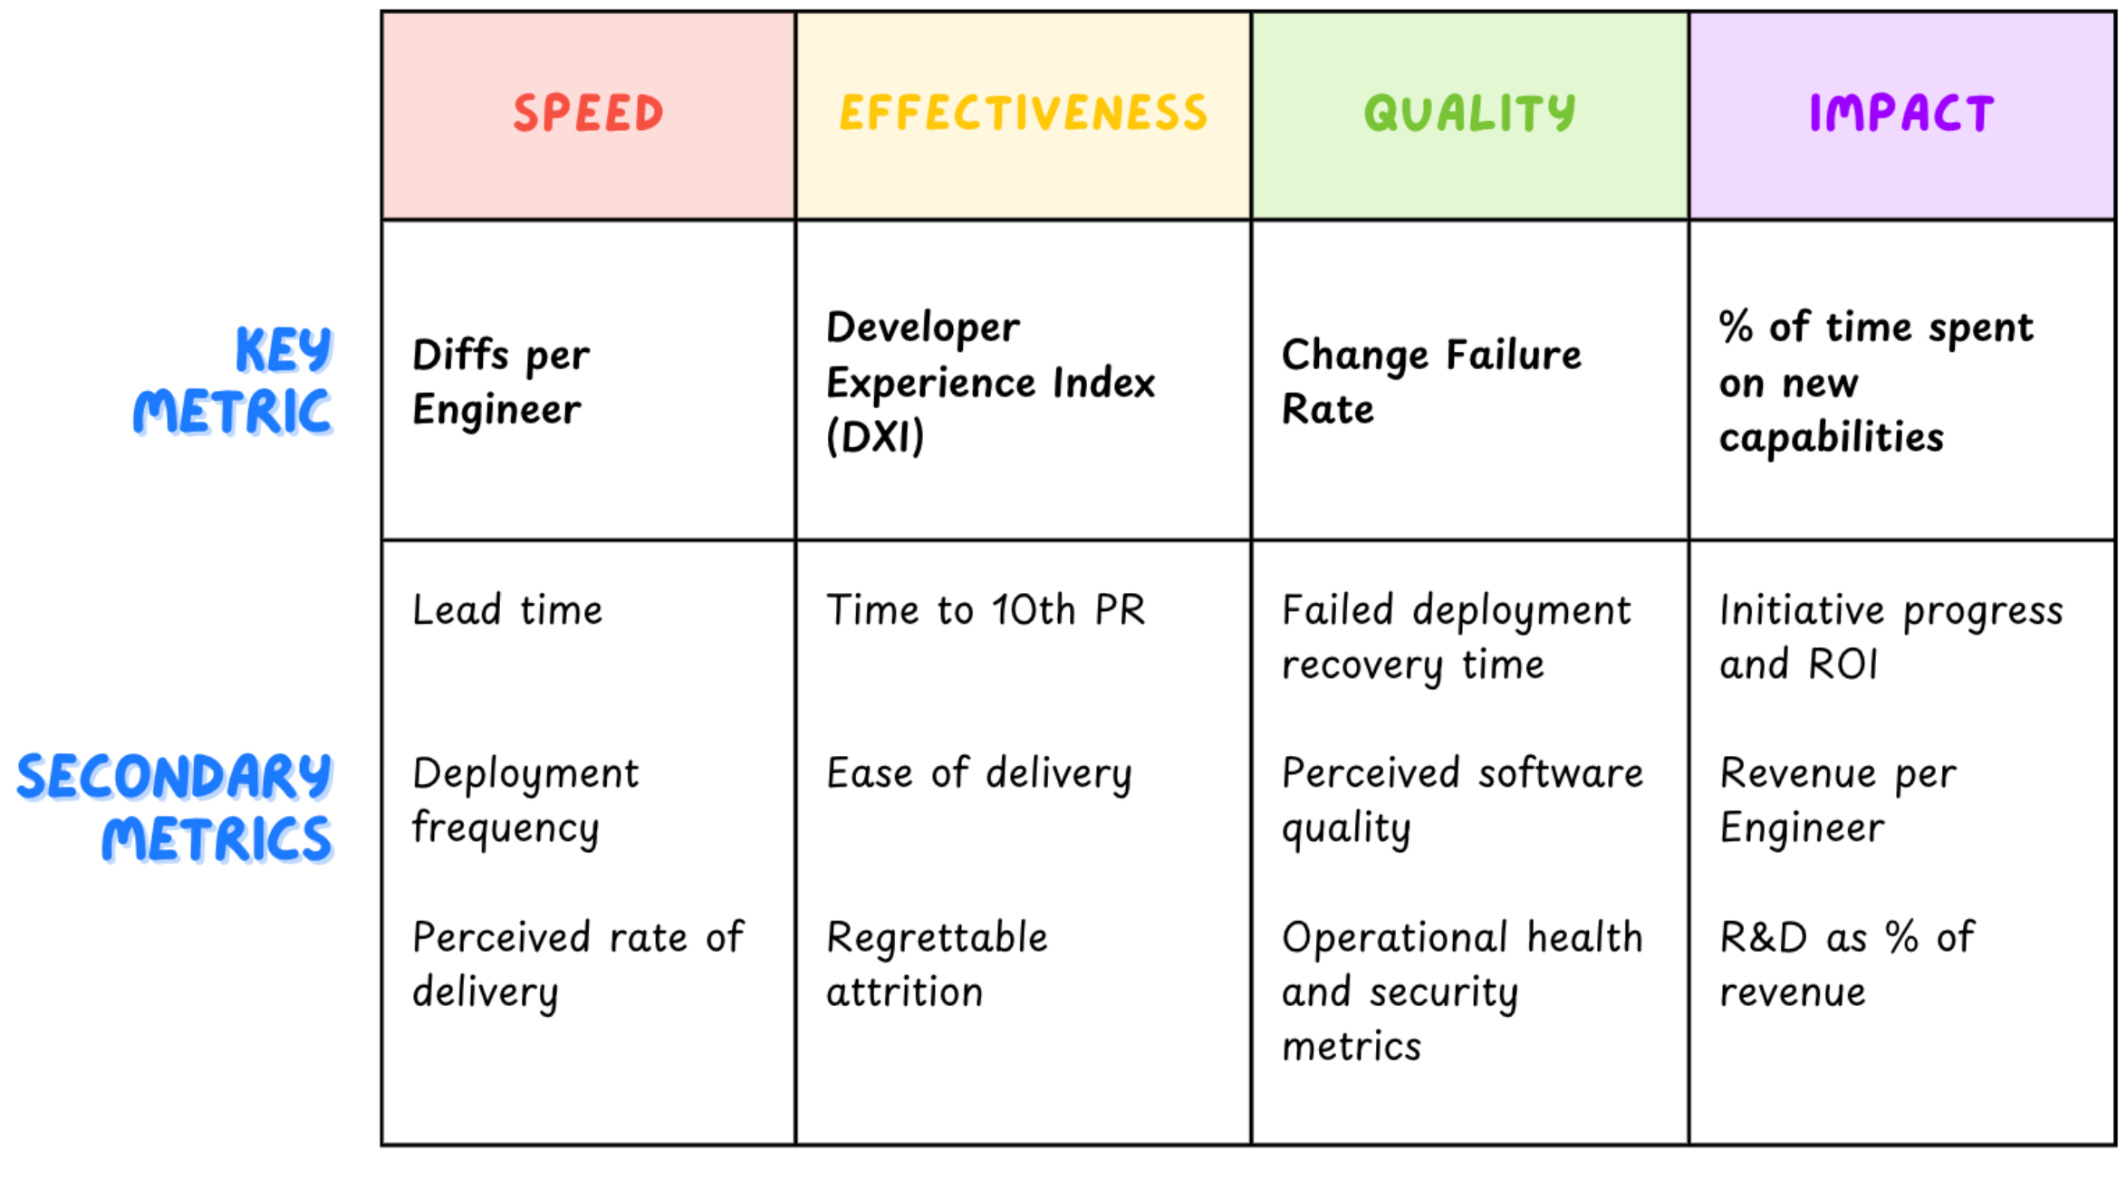
These dimensions pack both quantitative data a-la DORA (e.g. speed and quality), and newer qualitative measures, custom-designed by the DX team (e.g. effectiveness)
And that’s where things get interesting to me 👇
📊 From telemetry to holistic metrics
When people first started measuring engineering productivity they naturally gravitated towards what was easy to measure: telemetry data from our systems.
This wasn’t only the easiest way to get started — as engineers, it felt like the right way to do so, because it mimics how we instrument software: objective data, automatic collection, no human input!
However, telemetry data can only capture so much of the dev process — mostly delivery: PRs, commits, builds, and tickets — but of course there is much more to productivity. Things like cognitive load, documentation, quality of tooling, and collaboration, are hard to grasp from systems.
Enter surveys!
Surveys have become a widespread way to poll developers around devex, and we discussed it several times last year, for example in interviews with Charity, Laura, and Rebecca.
The problem has always been that surveys are qualitative and imperfect, and there was no standard way to run them.
DX Core 4, under the effectiveness dimension, tries to standardize this practice by defining DXI — the Developer Experience Index, which you can calculate by using a 14-question survey, battle-tested on several companies big and small.
DXI to me is probably the most interesting part of the framework as it does two things:
✅ Standardization — convincingly provides a standard template for devex surveys.
⚖️ Benchmarking — turns a qualitative measure into a quantitative one by creating an index, paired with benchmarks that correlate scores to business value,
"A one point increase in developer experience index score translates to about 15 minutes per developer per week of time saved." — Abi Noda
To me, this looks like the devex version of the Gallup engagement survey, which has been run successfully for decades, with great success.
But why does it matter to measure developer experience?
Most answers you can find are about getting a more holistic picture of your team, which is true, but doesn’t say much. I will go a step further and say that this data matters because, in most cases, it is the most actionable data.
Let me explain 👇
⬅️ From lagging to leading indicators
While talking with Abi, at some point we discussed the (in)famous “number of commits / day” metric. We both agreed that this is useful to measure, but ineffective (and even toxic) when set as a target.
But what does that mean? How can some data give useful directional information, but suddenly become bad if we try to optimize for it?
The answer lies in the difference between leading and lagging indicators.
➡️ Lagging indicators — are outcome metrics that show results of past actions.
⬅️ Leading indicators — are input metrics that predict future outcomes.
This difference historically comes from product management, but is extremely relevant in engineering, too.

Lagging indicators usually change slowly, are easier to measure, but harder to influence. They are perfect to give you long-term validation, but you can’t use them to change direction directly.
A product example might be revenues vs feature adoption. Revenue is what ultimately validates success, but you can’t just set a higher revenue target and wait for it to happen. Revenue is lagging — to improve it you need something more actionable that you can influence directly, like the speed of feature adoption, which is a leading metric.
So, back to our engineering case, the number of commits per day is a lagging indicator, and so are (mostly) the DORA metrics and the majority of quantitative engineering metrics. You can’t optimize for them directly, because they are downstream of everything that happens in the dev process.
When you treat them as upstream (leading) metrics, you fail because you are reversing the correlation/causation direction.
So, what is leading in developer productivity? As of today, the most convincing answer is developer experience. Good satisfaction across the various usual suspects (enough focus time, timely PR reviews, no waiting, dev environments seamless to setup, …) predicts speed, quality, and impact.
Now, developer experience is traditionally measured through surveys, which are good for surfacing top pain points. However, these are typically run infrequently (usually once per quarter), which means two things:
🤏 Granularity — you lack visibility into the smaller, daily points of friction.
☑️ Accuracy — being captured infrequently, survey data can be inaccurate because of memory decay and recency bias.
To improve on this, DX helps collect data in real-time, which looks very promising 👇
🤏 From surveys to experience sampling
Abi introduced me to experience sampling — a new approach to collecting feedback in real-time, right when developers are doing their work. It uses custom tools integrated into the dev environment to capture insights at key moments.
So, if a traditional survey is like a periodic medical check-up, experience sampling is like the fitness tracker checking your vitals throughout the day.
Experience sampling tools can prompt feedback during specific events, like after merging a pull request, after deploying to prod, or while using various dev tools. Questions are brief and contextual, like: “How smooth was this PR review process?”, or “How confident do you feel about this deployment?”
This approach brings two strong benefits:
📊 Precise data — every response has a clear context attached to it and is provided while the experience is fresh and top of mind.
🔍 Granular analysis — feedback provided is not aggregated, but related to individual units of work. This makes it possible later to break it down by dimensions like type of work, team, or project.
"If developers report friction in the PR process, you can actually go and look at those specific PRs. You get that linkage between objective events and subjective experience. It's almost the marriage of qualitative and quantitative data."
— Abi Noda
🔧 From what to measure to how to use it
In mid 2023 I wrote a long guide on how to get started with engineering metrics. There I argued that metrics adoption was graduating from innovators to early adopters.

This growth was enabled by the work of a handful of thoughtful people, like Abi, who are pushing tools and practices forward.
So, fast forward to today, what’s the state of engineering metrics?
We ran a recent survey about this, which shows that teams that use metrics 1) vastly increased during last year — they are now 45% of all teams, up from 33% — and 2) they report stronger performance than those who don’t use them.
This consolidation is also shifting the type of challenges these teams face.
In the early days, most questions I received about metrics were variations of: “what should I measure?” These days, I more often get asked “how should I use this?” — that is, people have a decent idea of what to track, but are still unsure of how to turn data into value.
The next frontier, to me, looks like operationalizing metrics — creating playbooks that explain how to embed data into processes, how to use it in conversation, and what’s the role of the various stakeholders in owning and improving metrics.
It is still a lot to do, but it feels we are on the right track.
📌 Bottom line
And that’s it for today! Here are the main takeaways from this piece:
📈 Engineering metrics are evolving — from simple telemetry to holistic measures that capture the full developer experience.
🎯 DX Core 4 hits a sweet spot — more comprehensive than DORA, more prescriptive than SPACE.
🔄 Focus on leading indicators — developer experience predicts and influences outcomes like speed and quality.x
⚡ Experience sampling is the future — real-time feedback collection provides more accurate and actionable data than traditional surveys.
🛠️ The next frontier is operationalization — turning good metrics into effective processes and improvement loops.
I wish you a great week! ☀️
Sincerely
Luca
 | A guest post by
|
There is always a danger when being driven with early metrics, especially leading one, and the developers know this one very well: early optimization is the root of all evil. It's especially severe in subjective metrics like survey. Like Continuous Delivery told us, "if it hurts, do it more often". A good coach will know the early results are likely invalid, that when adopting a new approach, you will see a decline in performance, that people usually resist changes and feel uncomfortable before adopting them and ripe their benefits. And let not forget Goodhart's law: any metric that become a target is no longer a good metric.
This for me is a big warning sign I would have on any DX approach too focus on metrics. And don't get me wrong: metrics are a good thing, but only if used at the end of a good design process. Metrics should always be the last part: set up a goal, ask yourself a good question about that goal, and then measure to answer your question. A metric should always stay a tool for learning, not a tool for leading (although good leaders should always learn using metrics).
Thanks for this article! Developer experience is something that is very high on my list of concerns. I have a question - do you know of any existing tools that can be used for experience sampling? I'd love to have this pop up on GitHub after merging a PR or sth like that